1008ICT Business Informatics
Module 5 - Processes, Software & IS Analysis
Basic building blocks for an information system
Learning Outcomes: |
|
Additional Material
IMPORTANT - Check out the slides down in the resources section! The notion of a Systems Development Life Cycle (SDLC) is raised and the component processes or phases that the systems analyst will take part in. Graphical tools for systems that aid in performing the analysis phase will be introduced so that we have a basic understanding before we tackle the intricacies of Data Flow Diagramming.Relevance
The material in this section will help you to start thinking in a system oriented way about organisations. In week one we defined a system as being made up of sub-systems and pointed out that it operated within some well defined environment. In any organisation that you can imagine it is possible to define those entities (people, other organisations, things) with which it interacts or operates in the process of doing business.
After completing the activities in this section your "imaginary" project business will seem almost real as you define its operation.
We introduce a tool, called Data-Flow Diagrams (DFDs) that have been used by systems analysts to help them define the internal and external entities of a business, internal business processes, business data, who sends it, who receives and where it is stored. This will give you a very structured way of thinking about any organisation. With DFDs it is possible to find bottlenecks that reduce the organisational efficiency and to design new processes to improve effectiveness.
Data is important! It has been stated that if an organisation loses enough data through disaster, accident or malicious means that it could easily be put out of business. What is the data that a business relies upon? In this section we will look at the items that make up business data, how it is defined and how it is stored.
This is key information before we consider the use of business' most important software application - the database. What we do here will allow us to effectively design the database tables that you will create in the next module of this course.
Once we have looked at the information created by some of the analysis tools we will can see how it helps define the processes and related software components that might be required to build an information system within an organisation.
Every organisation has goals and objectives. In order to reach those objectives from any given starting point there is a defined process or set of procedures to be followed.
Initially we do not need to know anything about the workings of a process. Knowing its name and the specification for its input and output is enough to define it logically.
Data Flow Diagrams - DFDs
Data Flow Diagrams (DFDs) are a tool that show how data moves through an information system. They are the basis for structured system analysis. They use four basic symbols to represent data flow and some basic rules for their construction. A DFD is used to create a logical model of the information system that shows "what" the system does not "how" it does it.
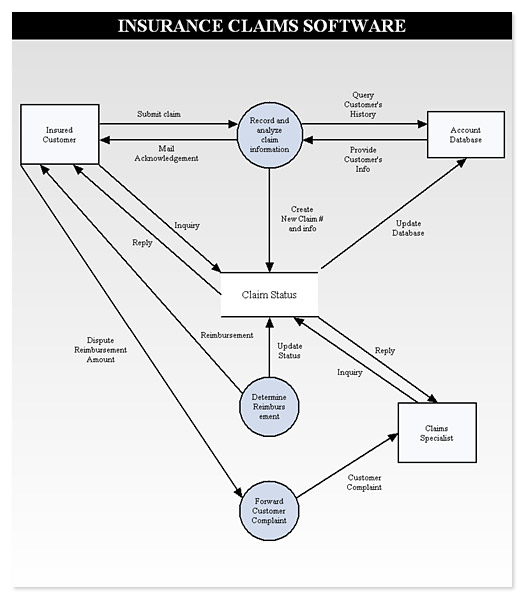
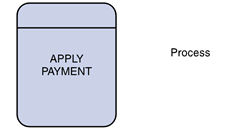
There are two main symbol sets that are commonly used to create DFDs. In this first image the symbol set is based upon that created by Gane and Sarson.
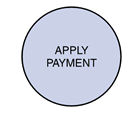
This next image uses a set of symbols developed by Coad and Yourdon. Sometimes just called the Yourdon symbols.
Various software tools exist that help with the efficient production of data flow diagrams as well as other types of analytical graphical tools. The images above were created with a tool called SmartDraw.
DFDs are a graphical tool that allows users and system designers to easily share information and meaning about the existing or planned information system. Kenneth Kozar from Colorado University suggests that DFDs are:
- graphical, eliminating thousands of words (and their misinterpretation)
- logical representations, modeling WHAT a system does, rather than physical models showing HOW it does it
- hierarchical, showing systems at any level of detail; and
- jargonless, allowing user understanding and reviewing.
On their own DFDs are limited so they are usually supported by other structured analysis tools such as Data Dictionaries, Data Structure Diagrams; and process (algorithm) modeling tools such as Decision Tables, Decision Trees and Structured English.
Kozar goes on to state that DFDs have the objective of avoiding the cost of:
- user/developer misunderstanding of a system, resulting in a need to redo systems or in not using the system.
- having to start documentation from scratch when the physical system changes since the logical system, WHAT gets done, often remains the same when technology changes.
- systems inefficiencies because a system gets "computerized" before it gets "systematized".
- being unable to evaluate system project boundaries or degree of automation, resulting in a project of inappropriate scope.
DFD Description
As stated above, a DFD is made up of four basic symbols representing "data flows", "data stores", "external entities" and "processes". A system can be represented at any level of detail by these four symbols. Each will be described below:
Data Flow
Data within data flows, in the real world actually represent things like characters and numbers and more complex things like emails, faxes, web forms, wordprocessed documents, spreadsheets, database queries and results and many other things. They will be different things in different contexts, for example in an eCommerce context data flows will contain orders, faxes, pay claims, receipts, invoices, packing slips, etc.
Data flows all have a single direction. They come from somewhere and they go to somewhere. They also have a name, in capital letters, that describes the type of data that it is a channel for.
The Data Flow symbol represents movement of data.
RULE 1: A data flow must have a process on at least one end.
RULE 2: Data flows are represented with a line with an arrowhead on one end. A fork in a data flow means that the same data goes to two separate destinations. The same data coming from several locations can also be joined.
RULE 3: Data flows should only represent data, not control.
RULE 4: Data flows are ALWAYS named. A name should not to include the word "data".
RULE 5: Data flows can be referenced by a combination of the identifiers of the constructs that the data flow connects. (14-A references a data flow from process 14 to external entity A)
A process to another process A process to an external entity A process to a data store An entity to another entity An entity to a data store A data store to another data store
Data Store
A data store represents a place that data stored for later use by one or more processes. In the real world this would actually be a hard disk or a database or some similar structured and indexed storage medium. If it helps, think of the student records that the university keeps to help with enrolments, graduation, grades, fees and any number of other processes.
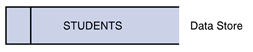
A data store is represented as a flat box with its name in capital letters.
The Data Store symbol represents data that is not moving (delayed data at rest).
RULE 1: A data store must have at least one incoming and one outgoing data flow
RULE 2: A data store should be named with an appropriate name, not to include the word "file", and numbered with a number preceded with a capital letter D
RULE 3: A data store can be duplicated, one or more times, to avoid line crossing.
RULE 4: A data store can be shared by two or mre systems. This can occur in the case of one system updating the data store, while the other system only accesses the data.
RULE 5: Data stores are detailed in the data dictionary or with data description diagrams.

External Entity
An external entity refers to a person, an institution or a department that is outside of the system being modeled. It is a thing where data originates (data source) and is usually a final destination (data sink). As such an entity is often referred to as a terminator. It is an "external" entity as it is external to the system itself.
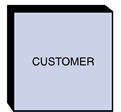
Entities are depicted using a square box with the entity name printed in capital letters.
RULE 1: An entity can be a source or a sink or both but each entity must be connected to a process by a data flow.
RULE 2: An external entity should be named with appropriate name.
RULE 3: An external entity can be duplicated, one or more times, on the diagram to avoid line crossing.
RULE 4: An external entity is used to help determine the system boundary. They are external to the system being studied. They are often beyond the area of influence of the developer.
RULE 5: An external entity can represent another system or subsystem.
RULE 6: External entities are drawn on margins/edges of data flow diagram.
Process
A process receives input data and creates output data that has a different content, form or both. A process is sometimes referred to as a transformation. In a business a process uses business rules or business logic to transform input data to produce specified results.
The symbol for a process is either a rounded cornered box or a circle with the process name in capital letters.
The Process symbol represents an activity that transforms or manipulates the data (combines, reorders, converts, etc.).
RULE 1: A process cannot produce an output data flow without at least one input data flow (Spontaneous Generation)
RULE 2: A process cannot receive input without producing an output (Black Hole)
RULE 3: A process cannot generate an output for which the sum of the input data types is insufficient (Grey Hole)
RULE 4: Each process in always "running" and ready to accept data.
RULE 5: A process is named with one carefully chosen verb and an object of the verb. There is no subject. Name is not to include the word "process". Each process should represent one function or action. If there is an "and" in the name, you likely have more than one function (and process).
RULE 6: Processes are numbered within the diagram as convenient. Levels of detail are shown by decimal notation. For example, top level process would be Process 14, next level of detail Processes 14.1-14.4, and next level with Processes 14.3.1-14.3.6.
A family of DFDs
DFDs are created hierarchically in a top-down manner. This means that the most general DFD is created first and this is called a "context diagram". The context diagram represents the entire system, sometimes called the "level 0" system and all of the external entities that interact with it along with their associated data flows.
The next level of detail is the "level 0 DFD" which represents the general or high level functional areas or departments as processes. As a complete diagram this contains data flows to and from external entities as well as the other processes at the same level. For a large system this diagram is often created in fragments such that one or two component processes and their data flows are represented in each one. When each fragment is complete then they are merged to create a complete diagram of that level.
Of course level 1 and level 2 DFDs contain more detail still and the family of DFDs is extended until all of the detail that describes the operation of the system is captured.
Building a DFD
Kenneth Kozar describes a very structured approach to creating a DFD that is reproduced here:
- Identify and list external entities providing inputs/receiving outputs from system;
- Identify and list inputs from/outputs to external entities;
- Create a context diagram with system at center and external entities sending and receiving data flows;
- Identify the business functions included within the system boundary;
- Identify the data connections between business functions;
- Confirm through personal contact sent data is received and vice-versa;
- Trace and record what happens to each of the data flows entering the system (data movement, data storage, data transformation/processing)
- Attempt to connect any diagram segments into a rough draft;
- Verify all data flows have a source and destination;
- Verify data coming out of a data store goes in;
- Redraw to simplify--ponder and question result;
- Explode and repeat above steps as needed.
Kozar's Tricks and Traps
- System boundary establishment is an important judgment call. External entities aid in determining where the boundary is established. An interfacing system can be shown as an external entity. It may be necessary to dictate the input of the external entity to assure system control. For example, customers may be required to submit orders or refund requests containing specific information which may require that the system aid in completion of a form. Use of output such as reports by management may require some agreement on tactics to be performed which may mean the entity becomes part of the system, not external to it. When in doubt, include the external entity as processes within the system and then evaluate with those concerned.
- Label your processes carefully and vividly. A process that is labeled "Produce Report" and has the output of "Report" tells a reviewer very little. If you have trouble labeling anything on the diagram, it often is because you do not have adequate understanding. Choose names carefully.
- Think logical, not physical. Ignore media, color, font, layout, packaging, time, sequencing, etc. Think "what", not "how". Something logical can be implemented physically in more than one way. Including "when" and "where" and "how" means you are getting physical.
- Think data, not control, flow. Data flows are pathways for data. Think about what data is needed to perform a process or update a data store. A data flow diagram is not a flowchart and should not have loops or transfer of control. Think about the data flows, data processes, and data storage that are needed to move a data structure through a system.
- Concentrate first on what happens to a "good" transaction. Systems people have a tendency to lose sight of the forest because they are so busy concentrating on the branches of the trees.
- Reviewers will not be convinced by confusion. A quality data flow diagram will be so simple and straightforward that people will wonder what took you so long.
- Data store to data store, external entity to external entity, or external entity to data store connection usually do not make sense. Data flows with an arrowhead on each end cause confusion in labeling. Do not use them.
- Do not try to put everything you know on the data flow diagram. The diagram should serve as index and outline. The index/outline will be "fleshed out" in the data dictionary, data structure diagrams, and procedure specification techniques.
Example Case Study - Medusa's Hair
Medusa's Hair is a popular hair salon in the city. They were one of the first small businesses in the hair industry to systematise and computerise some of their internal systems. With the development of Internet related technolgies it was decided to add new flexibility and functionality for the range of entities that interact with their business.
1&2. List of External Entities with related Data Flows
The list below gives a typical idea of the external entities that interact with a small to medium sized business. It is by no means complete though good enough to give an idea of the entities that interact with a hair salon business. Under each external entity is a list of data that pass between that entity and the business system. You will notice that as a list it is quite alot to absorb in one sitting. Oh dear! Seventeen external entities.
- CUSTOMER
- Request for appointment
- Confirmation of appointment
- Payment
- Invoice
- Receipt
- Product Order
- SALES REPRESENTATIVE
- Product information
- Product Order
- Invoice
- SUPPLIER
- Product Order
- Invoice
- Payment
- Order Return
- Reciept
- DELIVERY COURIER
- Delivery Docket
- Signed Delivery Docket
- APPRENTICESHIP BOARD
- Request for Apprentice
- Indenture Document
- TAFE
- Practical Assessment
- Assessment Request
- INDUSTRY ASSOCIATION
- Reaffiliation Request
- Payment
- Award
- ISP
- Request for service
- Bill
- Payment
- LANDLORD
- Rent Agreement
- Rent Agreement Copy
- Payment
- Reciept
- ELECTRICITY BOARD
- Bill
- Payment
- PHOTOGRAPHER
- Booking
- Photographs
- Invoice
- Payment
- LOCAL GOVERNMENT
- Rates Notice
- Payment
- STATE GOVERNMENT
- Business Registration Application
- Licence to Practice
- Invoice
- Payment
- FEDERAL GOVERNMENT
- Business Activity Statement (BAS)
- PAYE Tax Payment
- Company Tax Payment
- Tax Refund
- INDUSTRY SUPERANNUATION FUND
- Superannuation Payment
- BANK
- Deposit
- Withdrawal
- Statement
- Disbursement
- ACCOUNTANT
- Deductions
- Tax advice
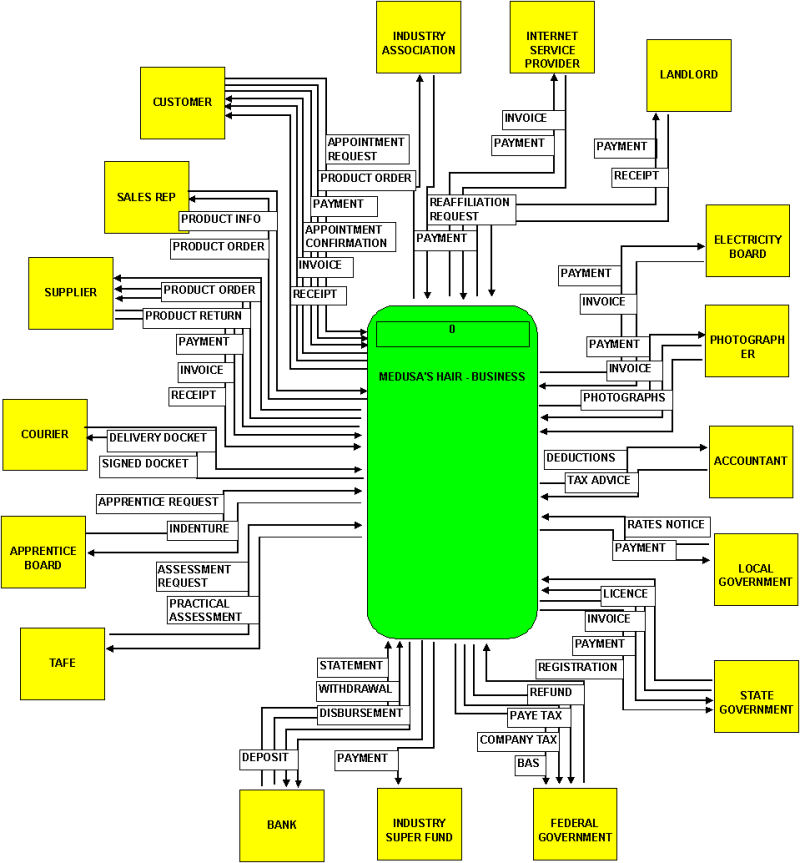
3. Context Diagram DFD for Medusa's Hair
A context diagram DFD contains the level 0 system, in this case the Medusa's Hair business. Let's see if this gets easier to handle as a context diagram showing how the external entities exchange data with the business system.
Even this is probably too detailed for a context diagram. Maybe you can think of ways to make it less detailed but still accurate?
4. Business System Functions
As a hairdressing business it has a range of different functions from customer service and product sales to accounting and professional promotion. Structure is everything. Often functions can be grouped under more general function banners. An ad-hoc list like this:
- Product Sales
- Hairdressing
- Beauty
- Human Resource Management
- Accounting
- Functions
Might easily be organised as the one below where departments (systems)are created and functions (sub-systems) assigned. If Medusa's Hair business is the level 0 system then the subsystems within it are level 1 systems. Each system or process contained within can be numbere accordingly.
- 1.1 PRODUCT
- Sales
- Product Orders
- Customer Orders
- Inventory Control
- 1.2 SERVICE
- Hairdressing
- Beauty
- Functions
- 1.3 MANAGEMENT
- Human Resources (staffing)
- Accounting
- Development
- Research
5. Data Connections Between Business Functions
What internal documents and communications are sent between the different departments within the organisation? These documents are separate from documents that are generated for use within the department and those that are used to connect with external entities.
The PRODUCT department interacts with all of the others departments as follows:
- Recieves order number for product orders to suppliers from MANAGEMENT
- Sends order request for product to MANAGEMENT
- Transfers payment for product bought by customers to MANAGMENT
- Sends stock sales report to MANAGEMENT
- Receives requests for stock transfer to SERVICE
- Sends stock transfer to SERVICE
- Sends administrative memos to MANAGEMENT
- Recieves administrative memos from MANAGEMENT
- Sends administrative memos to SERVICE
- Recieves administrative memos from SERVICE
The SERVICE department interacts with all of the other departments as follows:
- Transfers payment for services supplied to customers to MANAGEMENT
- Sends request for stock transfer to PRODUCT
- Recieves stock transfer from PRODUCT
- Sends request for staffing to MANAGEMENT
- Sends product usage report to MANAGEMENT
- Sends customer data to MANAGMENT
- Sends administrative memos to MANAGEMENT
- Recieves administrative memos from MANAGEMENT
- Sends administrative memos to PRODUCT
- Recieves administrative memos from PRODUCT
The MANAGEMENT department interacts with the other departments as follows:
- Recieves payment transfers from PRODUCT
- Recieves stock sales report form PRODUCT
- Sends order numbers for stock orders to PRODUCT
- Recieves payment transfers from SERVICE
- Recieves staffing requests from SERVICE
- Recieves product usage report from SERVICE
- Recieves customer data from SERVICE
- Sends administrative memos to PRODUCT
- Recieves administrative memos from PRODUCT
- Sends administrative memos to SERVICE
- Recieves administrative memos from SERVICE
6.&7. Confirmation and Tracing Data Flows
These segments ensure that what is supposed to happen in an organisation is really what does happen. If processes are bypassed or incorrectly described; or data communications are not sent or received, then this is important information that needs to be recorded in the logical model for analysis.
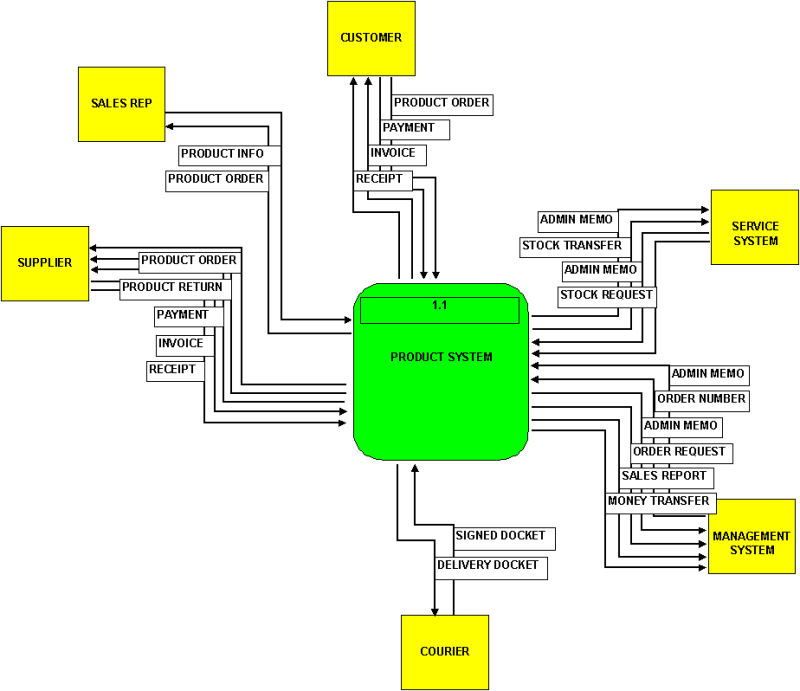
8. Create a level 0 DFD one segment at a time
Connect the external and internal data flows to each major process. At this stage it is helpful to consider each of the other internal departments or processes as external entities so as to reduce detail. Each major process or department can be considered in turn and then connected later. Here is the PRODUCT system with all of its data flows:
9., 10.&11. Verify Data Flows, Verify Data Stores and Redraw as needed.
Let us assume that step has been attended to. All data flows have a source and a destination and there are no data stores at this level to be concerned about.
12. Explode each of the processes, functions or systems and start again
We can now "drill down" and look in more detail at the PRODUCT system. Various subsystems can be identified based upon the activities that go on within the system.
1.1 PRODUCT SYSTEM – Subsystems and Data Flows
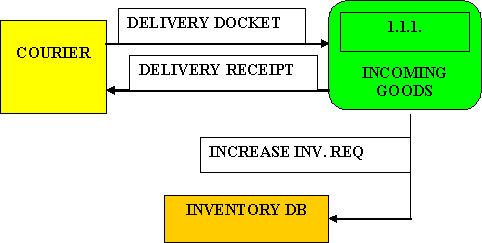
1.1.1 INCOMING GOODS
- Receive delivery docket (DF)
- Create delivery receipt (DF)
- Send increase inventory request (DF)
- Store inventory (P)
1.1.2 CUSTOMER ORDERS
- Receive customer order (DF)
- Fill customer order (P)
- Create packing slip (DF)
- Create invoice (DF)
- Send decrease inventory request (DF)
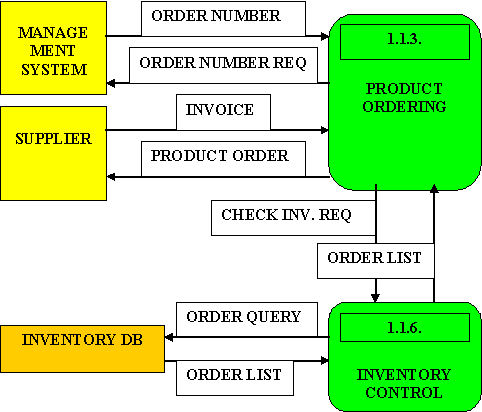
1.1.3 PRODUCT ORDERING
- Send check inventory request (DF)
- Receive order list (DF)
- Send order number request (DF)
- Receive order number (DF)
- Send product order (DF)
- Receive invoice (DF)
1.1.4 PRODUCT SALES
- Fill sale request (P)
- Receive payment (DF)
- Create sale receipt (DF)
- Send decrease inventory request (DF)
1.1.5 PRODUCT TRANSFERS
- Receive transfer request (DF)
- Fill transfer request (P)
- Send decrease inventory request (DF)
- Receive inventory receipt (DF)
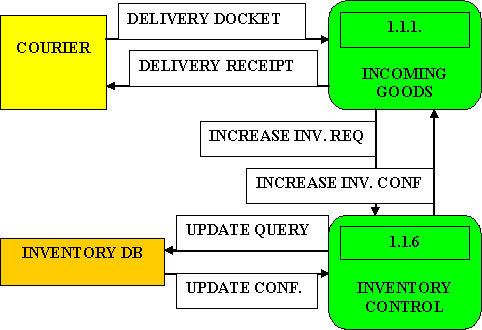
1.1.6 INVENTORY CONTROL
- Receive increase inventory request (DF)
- Receive decrease inventory request (DF)
- Receive check inventory request (DF)
- Send increase inventory confirmation (DF)
- Send decrease inventory confirmation (DF)
- Send update inventory query (DF)
- Receive update inventory confirmation (DF)
- Send order query (DF)
- Receive order report/list (DF)
- Send order list (DF)
1.1.7. STOCK CHECK
- Receive inventory level request
- Send inventory level query
- Receive inventory level report/list
- Send inventory level report
- Receive physical stock numbers
- Create shrinkage report
1.1.1 INCOMING GOODS SYSTEM – Subsystems and Data Flows (First try)
1.1.1 INCOMING GOODS with INVENTORY CONTROL
1.1.3 PRODUCT ORDERING with INVENTORY CONTROL
Computer Lab ExercisesWeek 7 - Data flow in the Organisation
Remember to “back up”. Have you got a copy of all of the files that you created on both your USB and network drives?
Resources List:
|
Updated by Heather Gray Feb 2011 |