1008ICT Business Informatics
Module 4 - Hardware & IS Design
Basic building blocks for an information system
Learning Outcomes: |
|
Additional Material
Relevance: A systems analyst will go into an organisation and develop an organisational chart that will show the logical structure of the organisation - the relationships between people, departments and possible communication patterns. As each person has particular tasks it is possible to estimate the sort of computing devices that they require to do their jobs. Similarly, a physical analysis of the organization in geographical terms can highlight the sort of networking infrastructure that would be required to ensure each employee was able to connect to the intranet service.
This information allows the analyst to design an information architecture that suits the current organizational requirements. Organizations are changing constantly so an information architecture must be easily adaptable to change and be robust enough to cope with extremes of use even in the face of disaster. A dead e-commerce server means loss of business unless this is planned for.
Change, redundancy, flexibility, growth are all concepts that are applied to businesses and any organization. We will deal with how a corporate information system can be designed to perform in a dynamic business environment.
Check out the slides down in the resources section! We will talk about the basic components that might be required to build an information system within an organisation.
What does the organisation do?
A business must have a mission. This is a simple statement of purpose that provides a goal for the organisation to align with. For a restaurant, it could be something as simple as: "To provide our customers with the ultimate dining experience by providing the most appetising cuisine, most excellent service and access to a truly comprehensive wine cellar." More complex businesses will break down their mission into a series of specific quality and purpose statements that becomes a "charter" for operations.
Engaging with this mission or charter provides the underlying standards for quality and a sense of purpose that promotes a spirit of competition in the business' operation. It is all about achieving a market share and creating customer loyalty. It is about instilling pride in the workforce and a sense of satisfaction knowing that they are providing key part of a worthwhile endeavour.
Organisations use, create, communicate and protect information as a basis for management and providing the goods or services that are their business. In the pursuit of their employment, workers at all levels are going to use procedures, data, software and hardware to facilitate their role in the organisation. The more usable the information system the more effective and efficient the business will be in reaching their goals.
Effectiveness and efficiency are the aspects to maintaining competitive services, customer satisfaction, workforce satisfaction and management responsiveness and flexibility.
Every organisation has a unique structure both logically and physically. One business could be on one room or one building where another may be on several campuses world-wide. Today's communication and computer technologies allow us to create an "information architecture" to suit a wide range of business configurations. Information Architecture is defined as:
- An overall technology strategy for an enterprise.
As technology is improving and changing constantly it is always important to keep up in order to maintain productivity and competitiveness. Larger organisations, like GU have their own IT department. Smaller organisations often farm this part of their operations out to specialist service providers. In either case
- IT department uses procedures and software to maintain hardware and software applications
How is the organisation structured logically?
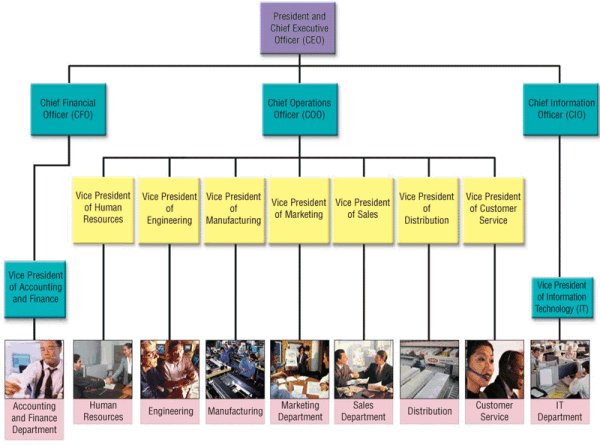
Every organisation has a departmental structure that breaks the operation down into task types that completes various different apects of the business. Even when the organisation is a single owner-operator the tasks can be broken down into things that are to do with Sales, Advertising, Marketing, Finance, Accounting, Logistics, Production, Design, Engineering, Administration, Human Resources, Customer Relations, Service, Management and many others. This logical organisational structure is reflected in a structure chart and sometimes appears as a tree or hierarchy.
Different people in different parts of the organisation are going to have different information and technology needs depending upon their roles.
How is the organisation structured physically?
Let us start with a small manufacturing or service oriented business operation with a production or work area, a warehouse or storage area and maybe an office for administration and management. For this example let us say that it can be housed within one building such as a small factory or commercial premises.
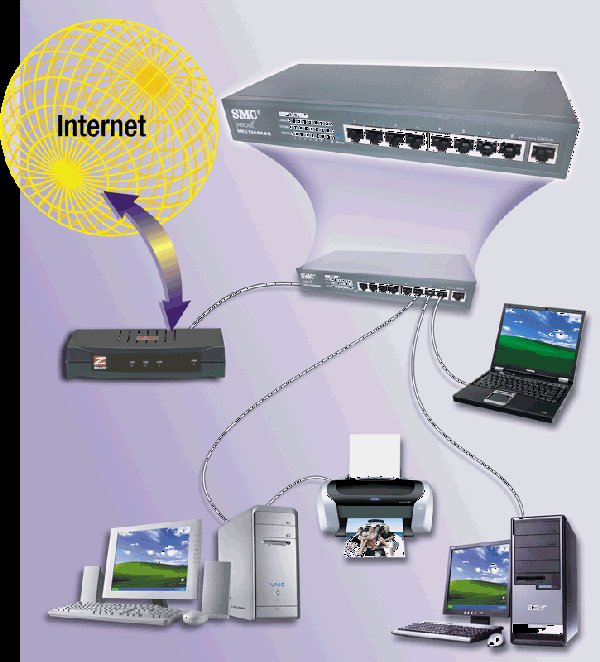
Essentially there needs only to be a single local area network with access to the Internet via a broadband router with a firewall. The business is in one building or one room and so the choices for networking and communication in general are simplified.
Successful businesses are want to expand their operations and spread out to service other areas. What would happen if the small business started up another factory across the road? How might their communications infrastructure need to change to allow the organisation to be logically connected when they are physically separated? In this case maybe a second broadband router for the new factory and then set up a VPN (Virtual Private Network) over the telephone or cable network.
There are many options depending upon a range of conditions:
- Communication density or network throughput (Mbps) that is required between sites or campuses
- Availability of a common line of site contact point (microwave hub)
- Presence or absence of high energy electrical noise
- Radio coverage.
The Queensland government is housed in several buildings within the CBD of Brisbane. Because few of the buildings had line of site for microwave communication and because the network throughput was in excess of what the telecommunications infrastructure could affordably carry for a large while they elected to use satellite microwave communications to connect each of the buildings.
Similarly, GU has several campuses including the Gold Coast Hospital, Parklands, Logan, Nathan, Mt Gravatt and Southbank. We use a common line of site link to Tamborine mountain (all campuses have unhindered line of site) where a microwave repeater ensures that each of the campuses remain connected.
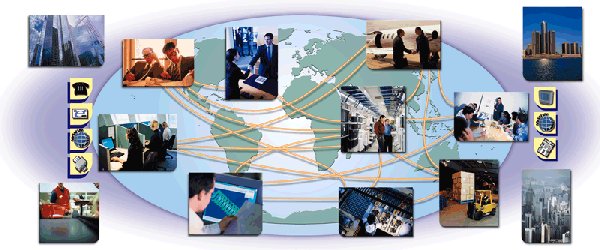
Once businesses expand their footprint to other regions, states or countries then different options for Wide Area Networking must be employed. Generally these require the telecommunications infrastructure that makes up the Internet backbones around the world. Communications media may include microwave links, satellite links, undersea optical fibre cabling and high capacity telephony networks.
How is the organisation structured in terms of network load?
In many organisations different departments will create different loads on the network and so the network must be designed around the types of user and usage requirements for efficient and effective operation.
Because different tasks have different intrinsic requirements for network bandwidth (Mbps) it is not unusual to find different departments creating different amounts of network traffic. The everyday administration office may have five users developing wordprocessed documents or spreadsheets that maybe respond to email infrequently as well as access the corporate intranet to access different bits of information. In a situation like this and taking into account any peak times, the average office would put very little strain on a 10 Mbps network.
Five different users that were creating streaming video on high end graphics engines or even a network gaming site where graphical images are being constantly updated would cause a much higher level of network traffic that could reach into the 100Mbps range. Wired networking is capable of this kind of traffic but knowing that the throughput of a WiFi network is either 54Mbps or 108Mbps you would have to think carefully about installing a wireless network system.
Imagine an online order processing system where there may be one or two database servers (standalone computers) that are constantly processing requests for stock, shipping, availability, payment, maintenance and other things from hundreds of users at the same time. The network traffic generated at those two computers can be immense and if there is insufficient bandwidth to handle all of those requests then the system may slow down to a point that customers or clients find it unusable. A large database server may utilise a large part of a 100Mbps or even a 1000Mbps (1Gbps) network connection.
Network links between campuses in GU operate at 300Mbps but the average network usage of each of the several thousand computers is very small. The largest traffic contributers are the Database servers for things like enrolment, the WWW servers for corporate information and the email servers that allow communication.
People - Who are the users and what do they do?
Every organisation is different and even amongst organisations that do the same thing, they all do it slightly differently. A systems analyst will enter an organisation in order to gain a perspective of how the organisation operates, how information flows and the roles that each of the members of the organisation plays.
The kinds of information that an analyst will gather come from simple questions that may be answered through interview or simply observation.
- Who are the people in the organisation that you are analysing?
- Customer relations using phones and customer management software
- Front of house at a restaurant or retail POS operators
- Mobile salespeople
- Multimedia developers
- Designers
- Upper (strategic decisions) management
- Middle (tactical decisions) management
- Operations (operational decisions) management
- Financial controllers
- Office and administration staff
- Reception staff
- Human Resource Managers
- Games testers
- Network maintenance engineers
- Software developers
- What do they do with the information system?
- log on to it from remote locations
- access it to download/upload information after being away from the office
- use it to create documents, browse the Web and send email
- connect wirelessly
- sit at a desktop workstation
- use it for cooperative or collaborative design or document creation
- networked virtual reality
- connect wirelessly
- What documents do they create or process?
- text documents (email, wordprocessed, spreadsheets, databases, HTML, PDF, etc)
- image documents (.gif, .jpg, .bmp, .raw, .tif, etc)
- video and sound documents (.wav, .mov, .mpg, etc)
- What software do they use?
- Wordprocessors
- Spreadsheet
- Web page creation
- video/image editing
- CD/DVD creation
- Intranet communication
- Email client
- Specialist software
- What are their information needs?
- access to WWW, intranet, corporate databases, email service
- ability to communicate continuously
- ability to communicate asynchronously
- ability to save and manipulate huge files
- ability to find corporate information quickly
- ability to create reports of a particular format
- ability to create and test software
- Who do they communicate with?
- coworkers
- managers
- customers
- suppliers
- internal users only
- external users
- How do they communicate?
- telephone
- mobile telephone
- Internet telephone
- web forms
- memos
- calendar entries
- wireless - bluetooth
- wireless - WiFi 802.11b/g
- IR
- RFID
- What records do they need to keep?
- customer related notes or messages
- logged jobs
- completed jobs
- time management
- costing
- reporting
- item related comparisons
- employee data
- customer data
- supplier data
- pricing data
- design documents
- Do they have special needs?
- colour blind
- blind
- deaf
- physically disabled
- different language
- application specific help
Availability & Redundancy - A question of need
Availability is all about how often an information system is accessible by those that interact with it to perform their tasks. In computer jargon it is measured and referred to as "uptime". Most businesses require that their system has the highest possible uptime and expectations for a high availability system are around 99.9% of time.
Computers, software and machines in general have a working life and require regular maintenance in order to operate efficiently. If a part of a system must be made inaccessible while maintenance is carried out that can affect the smooth operation of the business. If you have an online e-commerce system then as soon as you give the system "downtime" then you are losing business and potential sales.
In order to maintain a high level of availability for systems, key parts like servers or communication links may be replicated or mirrored. If one machine goes offline for a period then the second will carry on operating. Having multiple copies of hardware like computers, processors, harddrives and other items is called providing redundancy.
Scalability & Interoperability - A question of growth
Organisations grow and shrink and change shape depending upon a range of stimuli and needs. When designing and developing an information system it is important to take into account that change will occur and to design with the future in mind. If an information system can effectively grow and shrink with the organisation that contains it then it is considered to be scalable.
The system development lifecycle is such that organisations may undergo a continuous process of upgrade and replacement especially as new technologies and software become available or even required. It is quite common for an organisation that has an information system based upon older technologies to keep their data and important information in its current format. In order for a system upgrade to be worthwhile, any new information system components must be able to communicate and interact with the older parts of the system for as long as required. Designing composite systems so that the different parts and technologies are able to communicate and cooperate is called making them interoperable.
Hardware - What are the building blocks for the physical information system?
In general, these days most organisations that are service oriented have a "computer on every desk" policy so that all workers have access to the information that they need to perform their duties. There are exceptions in manufacturing and other industries but let us assume for the point of information system design that everyone in an organisation has access to the information system.
Everyone that spends time working at a desk needs a desktop computer of the specifications that suits their job (See slides in resource section).
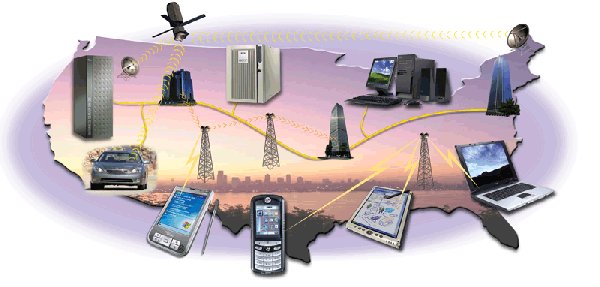
Everyone that is predominantly mobile in their job needs some sort of mobile computing device. Those that need to process documents or access corporate information remotely should have something like a notebook or tablet PC. Those that need to access basic email and workflow or appointment information might need a handheld device like a PocketPC or other PDA.
Every person working in a given physical area needs to have access to the corporate information system which means, at a minimum, they should all have access to the internal network. The options are to provide:
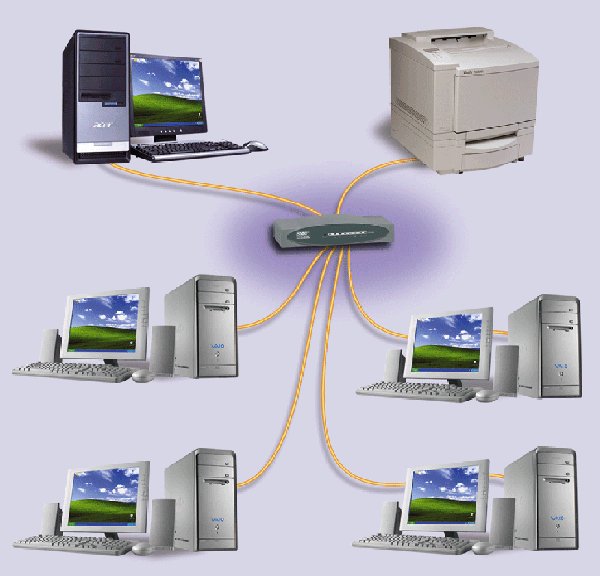
- Local area cable network between 8 or less employees using a central hub or switch and sharing drives and data mutually
- For larger groups a wireless access point with one port (cable outlet) connected to the intranet, file or database server, other ports connected to other wired network hardware like servers or printers and a wireless network adapter for each machine on the network
- If wireless communication is not appropriate then a network of switches (5, 8 or 16 port) and/or hubs to connect each of the computers in the area by cable to the intranet, file or database server and a network adapter card for each machine on the network.
If access is required to the Internet or to the public network in order to communicate with suppliers, customers and other parts of the organisation then a slightly different approach is required.
- A router to connect to the broadband Internet on one side and one or more of the local area ports to connect to the internal LAN described above on the other
- Wireless broadband router
- Cable modem/router
- ADSL modem/router
- Others
General Network Design Rules
- One router for each network transition. Internet – LAN or LAN – sub-network
- Most routers have 4 or 8 ports (connections) for sub-networks
- Most routers can process 100Mbps
- Servers that have high traffic (10Mbps-100Mbps) put on their own sub-network
- Servers that have lower traffic (up to 10Mbps) put on their own port of a switch at a high level of the network hierarchy
- LAN with 8 or less computers creating low traffic could be connected to a hub
- LAN with 8 or less computers with one or more creating high traffic should be connected to a switch
- LAN with 9 or more computers should be connected by a switch
- Every networked computer requires a network card (adapter)
- Every wirelessly networked computer requires a wireless network adapter (some have built-in WiFi)
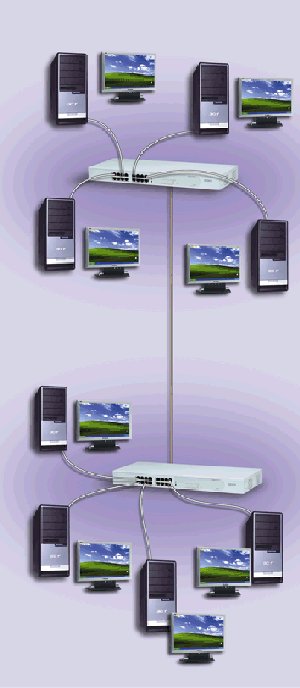
- One or more ports of a switch might be connected to other switches or hubs
- Most desktop computers (at GU) generate significantly less
than 1% of 10Mbps (100Kbps) network traffic except at peaks when
downloading large files so be very conservative in throughput
estimations
If several 10Mbps star networks are connected to a central switch then the central switch would probably require a 100Mbps throughput capability
Network speed terminology
Bandwidth and throughput are used as measurements of how much data (bits or bytes) can be sent in a period of time along a transmission line or network link. The measurement used is Mbps or megabits per second and is sometimes referred to as the speed of the network.
Here is a useful case to use as an example of the hardware requirement analysis
Software - How to make the computer do a job
Every computer needs to have software to perform certain tasks (See slides in resources section). The basic sorts of software are:
- Operating system
- Unix
- Linux
- Windows
- MacOS X
- palmOS
- Tools and utilities
- Firewall
- Zip software
- VPN software
- AntiVirus software
- Adware detection software
- Communication clients
- Browser
- FTP
- Telnet
- (IR)Chat
- Instant messaging
- Application software
- Office productivity
- Graphics production
- Video production
- Multimedia development
- Web development
- Application development environments (programming languages etc)
- Task specific software
Task specific and "enterprise" software
Specialised jobs often require specialised information and data processing capabilities depending upon the operating environment. Users in different roles in the organisation will use different types of software in order to perform their particular tasks.
Within an organisation many specialist or department-specific applications can all be linked within the corporate system to provide information mutually as required. Just as people in different departments of an organisation must communicate and swap data so this can be accomplished within the enterprise computing environment.
Information from reports are used by management as feedback to control the operation at different levels. Sales reports and inventory changes may be linked to manufacturing and engineering departments and/or ordering and logistics depending upon how the organisation works.
Specialist software includes:
- Finance
- Budgeting
- Forecasting
- Cashflow
- Investment management
- Accounting
- Accounts payable
- Accounts receivable
- Cash accounting
- Financial reporting
- Human resources - HRIS
- ERM - Employee relationship management
- Engineering and design
- CAD - Computer aided design
- CAE - Computer aided engineering
- Manufacturing and production
- CAM - Computer aided manufacturing (computer control of equipment)
- CIM - Computer Integrated Manufacturing (computer management of orders, inventory, parts etc)
- Resource management
- ERP - Enterprise resource planning
- MRP - Manufacturing resource planning (links with CIM above)
- Marketing information system
- Sales force automation software (SFA)
- Distribution management
- package tracking
- Customer Interaction Management (another CIM)
- software to manage notes from phone calls at call centers
- Office Information Systems
- Productivity tools - wordprocessors, spreadsheets, database production,
- Communication tools - email, intranet
- Transaction processing system
- POS terminals
- Online payment
- Funds transfer
- Receipts
- Invoices
- Management information system (MIS)
- Reporting
- Feedback
- Control
- Decision support systems (DSS)
- Analysis tools
- Rules, knowledge, limits
- Executive information system (EIS)
- Expert system
- Artificial intelligence - inference rules
- Knowledge base
- Enterprise resource planning (ERP)
- Coordination of different functional units within the enterprise
- Content management system
- databases and procedures to manage access to documents
Suppliers
- Dell Computers - Online Sales
- Hewlett-Packard - Online Sales
- Compaq Computers - Online Sales
- Apple Computers - Online Sales
- Harris Technology: The IT Experts
- AussiePCShop - Online Sales
- Technology Warehouse Australia - Online Sales
- Calibex - Online Software Sales
- TechBuy - Online Sales
- i-Tech - Online Sales
Information
- Dux Computer Digest - What is the difference between a switch and a hub?
- About.com - What is the difference between a switch and a hub?
- Ask Leo - What is the difference between a hub, a switch and a router?
- Dux Computer Digest - Differences between an Ethernet hub or switch and a broadband router?
- ZDnet - Difference between Bluetooth and WiFi?
Match the concepts
Data A ASCII Primary Storage B Hard Disk Web Address C Network Binary System D Information Secondary Storage E 16 bits Interconnected Computers F Random Available Memory executable file extension G Executes Instructions text only files H .exe Basic language of the computer I URL Byte J Random Access Memory Control Unit K 1's and 0's Computer CPU Speed L Machine Language M Megabytes N 8 bits O Decodes Instructions P Gigahertz
Computer Lab ExercisesWeek 4 - Design and Organisation Structures
IUD Evaluation - Due 5pm Friday Week 4
Total marks will be divided by 10 to give a mark out of 5 Week 5 - a crowbar and a decision toolIn the spreadsheet that you started last week, create a new worksheet and name it "Functions" as we will use some of the many functions that Excel supplies. To put this in perspective, there are several areas of the Systems Analysis phase that require simple calculations, decisions and tables to be created. An example of this might be a decision table or tree. The relevance of these exercises will become apparent as you develop the worksheet. You may not finish this exercise in a week but try to complete as much as you can. NB: The help in MS Excel is and excellent source of instruction for many of the formulae NB2: While creating formulae by typing or using a wizard, never click on a cell before you have finished the formula by hitting the enter key. (Okay, try it and see what happens :-) )
IS Design Report Part A - Due 5pm Friday Week 5
Total marks will be divided by 8 to give a mark out of 10
Week 6 - Spreadsheets and Networks
Reflect - Make an entry in your Blog that outlines the new knowledge and skills that you have gained from this week's lessons. Think about what you have done above and answer these questions:
Focus:What have I learned?
Remember to “back up”. Have you got a copy of all of the files that you created on both your USB and network drives? |
|
Resources List:
- Shelly, B.G., Cashman, T.J., Vermaat,M.E., "Discovering Computers: A Gateway To Information 2006", Chapters 3,4 & 7, Thomson Course Technology, 2006
- Powerpoint slides: Hardware and Software
- Shelly, B.G., Cashman, T.J., Vermaat,M.E., "Discovering Computers: A Gateway To Information 2006", Chapters 2& 9, Thomson Course Technology, 2006
- PowerPoint slides: Networks and Components
- Florida Gulf Coast University - Online tutorials (Word, Access, Excel, etc)
Updated by Heather Gray Feb 2011